eZorro Platform User Guide
Chat-first AI trading assistantQuick Start
eZorro is designed around chat. Ask questions, generate outputs (charts, news, tables), create strategies, backtest, and (optionally) connect a brokerage account to view portfolio data and enable trading with approvals.1. Create an account and sign in
Login Page
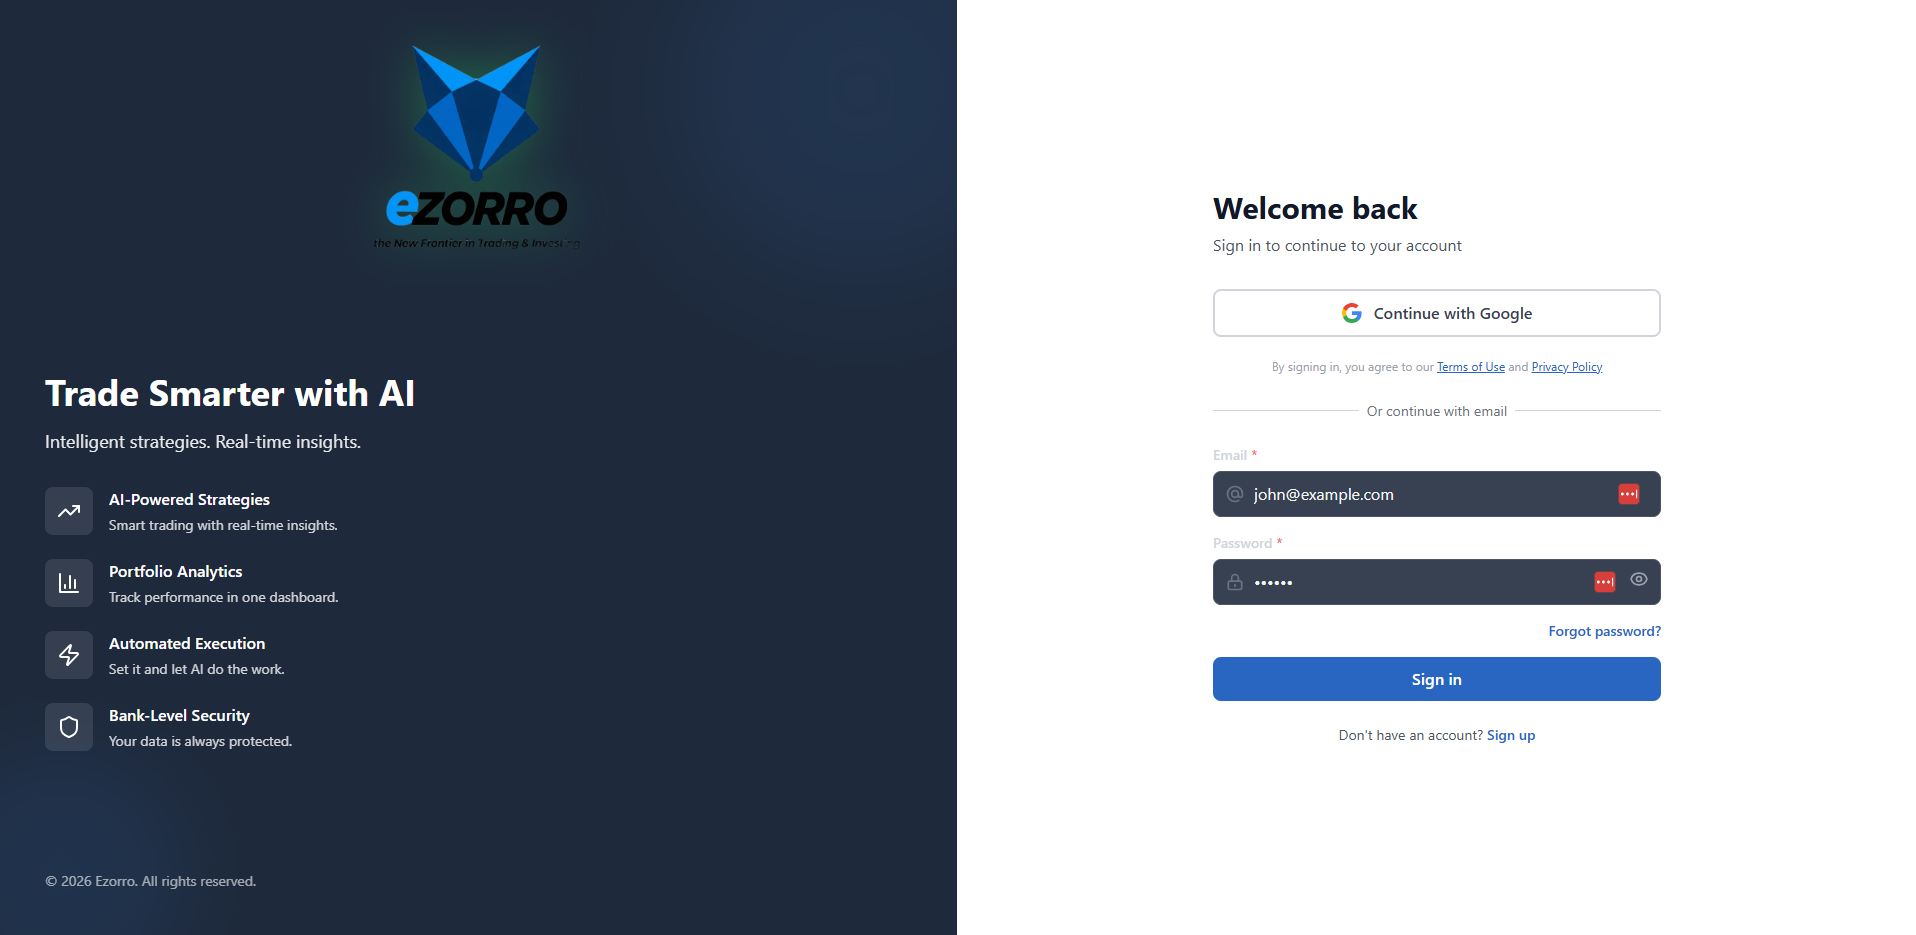
Option A — Sign in with Google (recommended)
Use this when you want the fastest login and fewer passwords to manage.- Click Continue with Google.
- Choose the Google account you want to use (or sign in to your Google account if prompted).
- Approve the consent screen (if shown).
- You’ll be returned to eZorro automatically and signed in.
Option B — Sign in with email and password
Use this when you prefer a standard username/password login.- Under Or continue with email, enter your Email.
- Enter your Password.
- (Optional) Use the eye icon to show/hide the password while typing.
- Click Sign in.
For security, login forms handle errors safely (e.g., not revealing whether an email exists) and protect against brute force/credential stuffing.
Forgot your password?
- Click Forgot password?
- Enter the email used for your account.
- Follow the reset instructions you receive (email link/code), then sign in again.
Create a new account (Sign up)
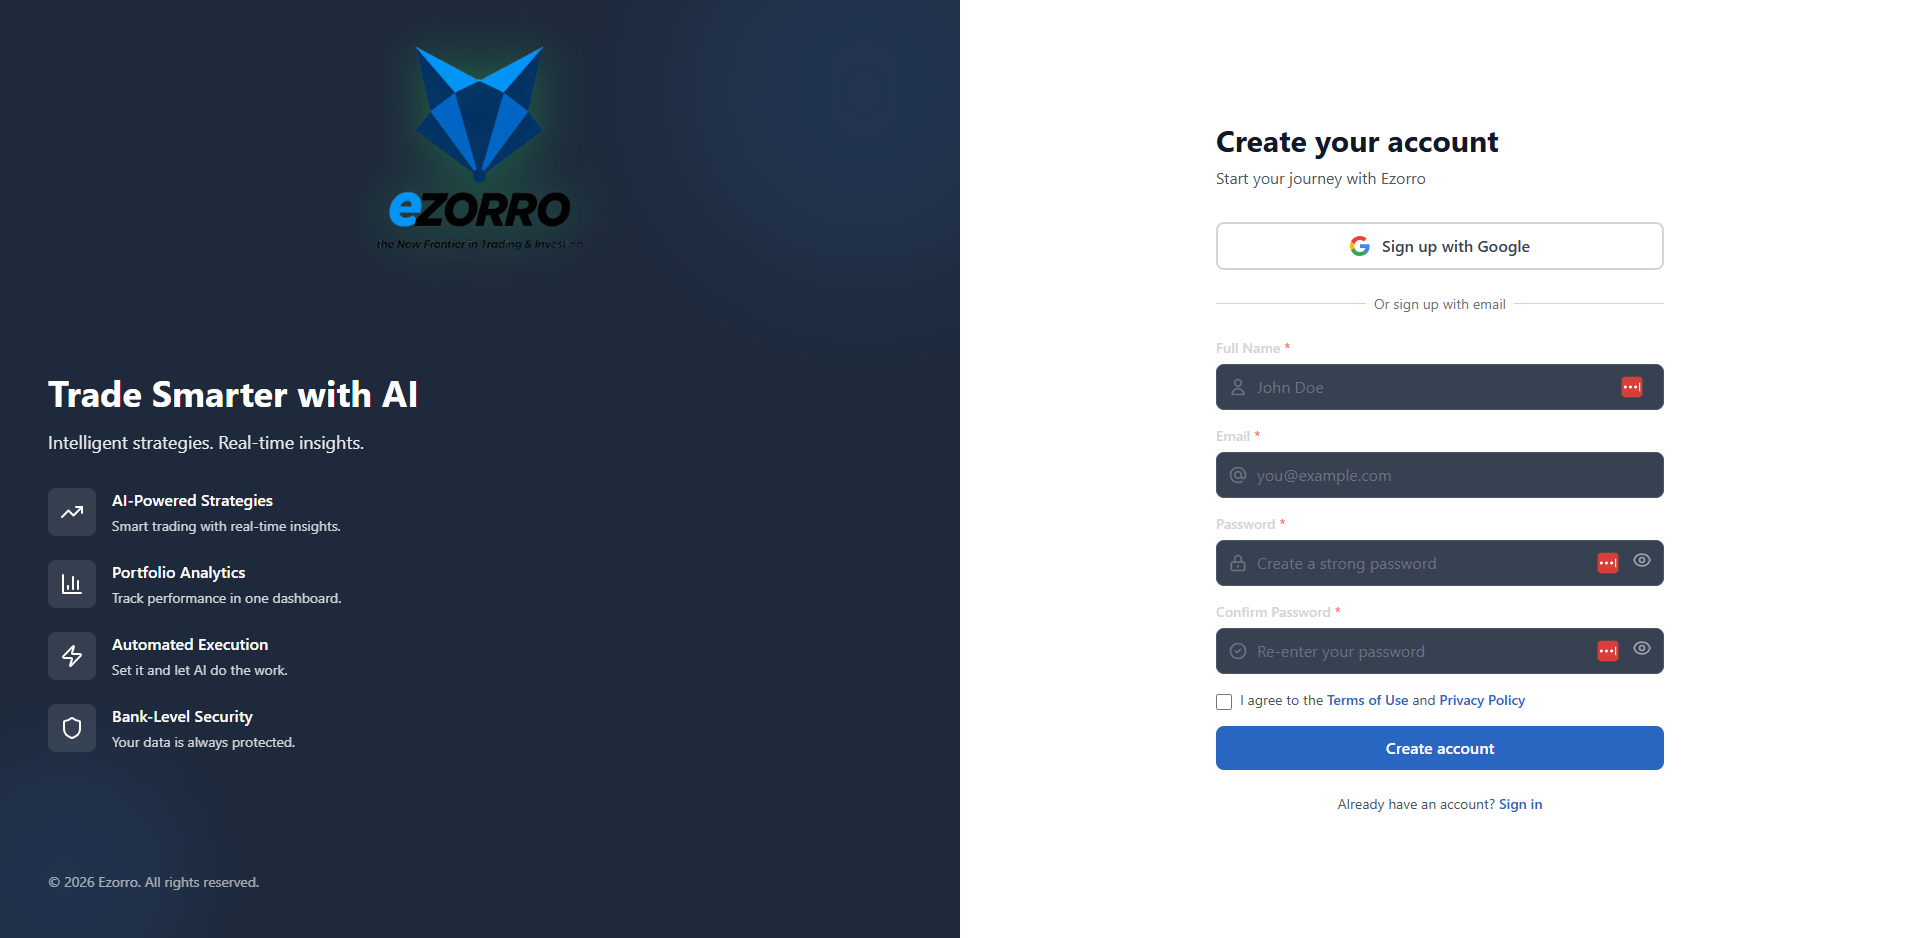
- Click Sign up with Google.
- Choose your Google account (or sign in if prompted).
- Approve the consent screen (if shown).
- You’ll be returned to eZorro and your account will be created automatically.
- Enter Full Name.
- Enter your Email (this will be your login username).
- Enter a Password.
- Re-enter the password in Confirm Password.
- Tick I agree to the Terms of Use and Privacy Policy.
- Click Create account.
Terms and privacy
Before signing in, users can open:- Terms of Use
- Privacy Policy
2. Start a New Chat and ask for market data, news, or analysis
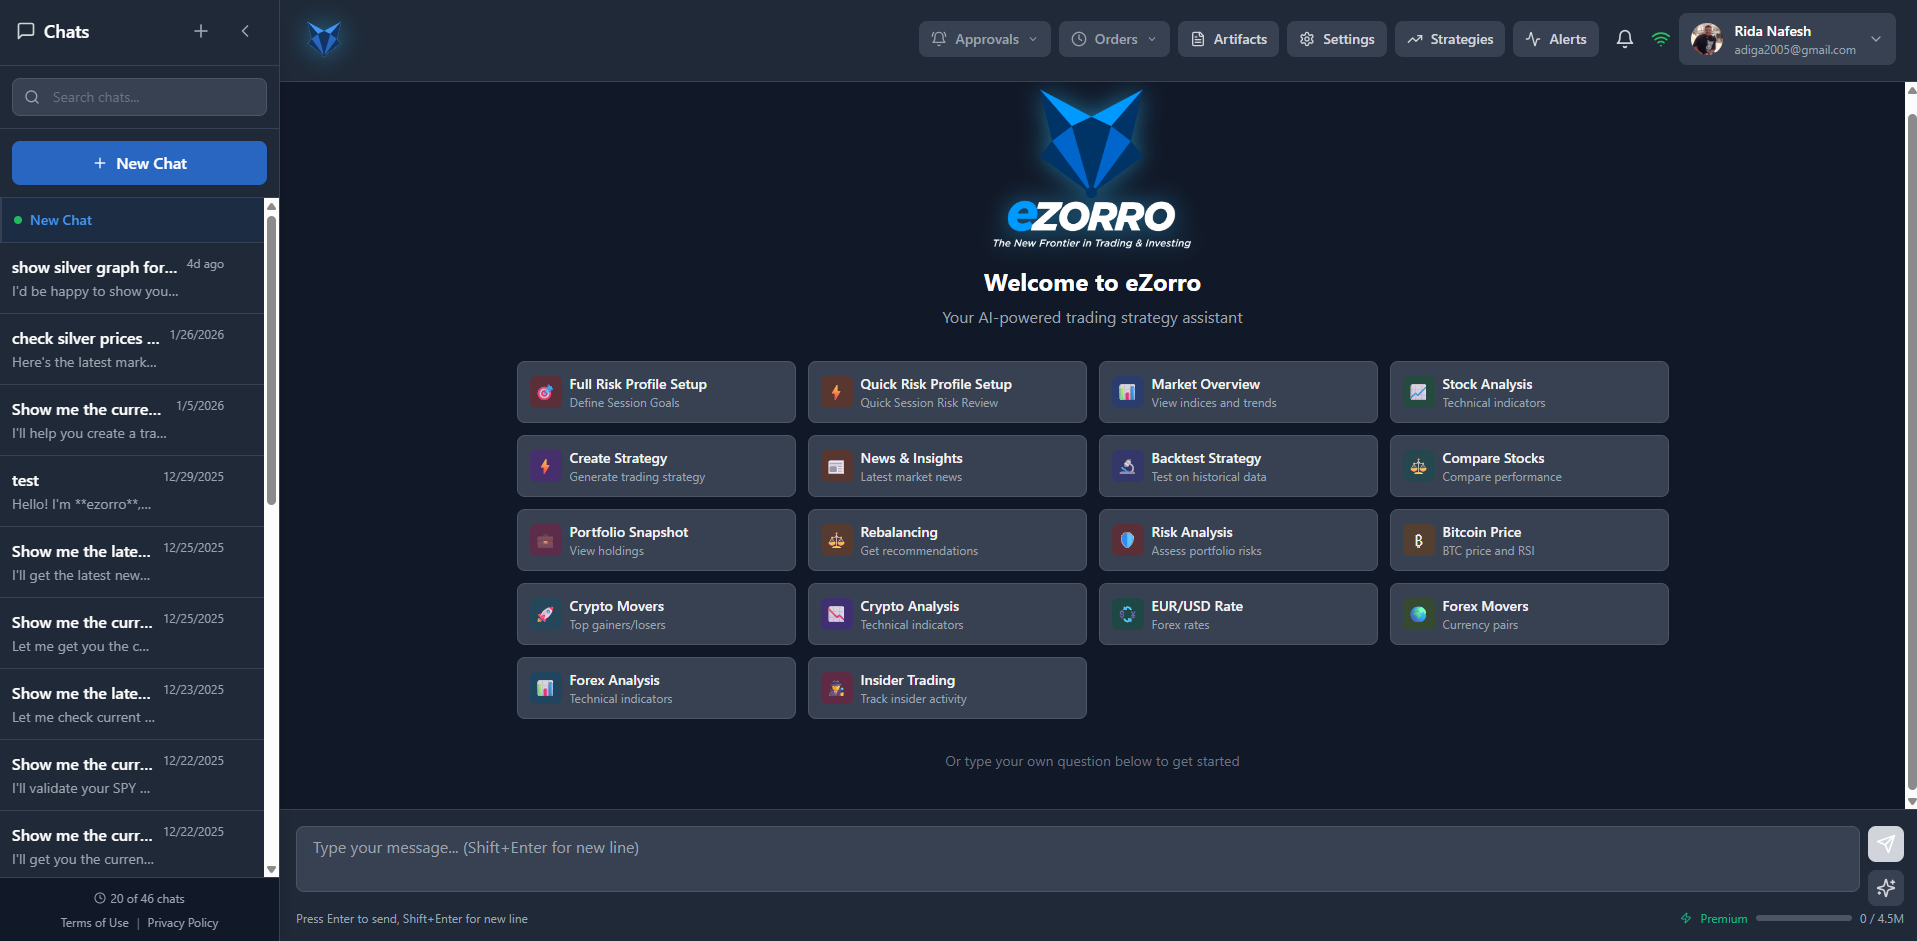
Start a new chat
- In the left sidebar, click New Chat.
- A fresh conversation opens in the main workspace.
- Type your message in the input box at the bottom.
- Press Enter to send. Use Shift + Enter to add a new line.
Continue an existing chat
- In the left sidebar, scroll the chat list and click any previous chat.
- The conversation reopens so you can continue with follow-ups (e.g., “backtest that strategy” or “show the 1H chart”).
- Use the Search chats… field to find older chats by keyword (symbol, strategy name, topic).
Keeping continuity in the same thread helps the assistant stay aligned with your prior context and reduces re-explaining.
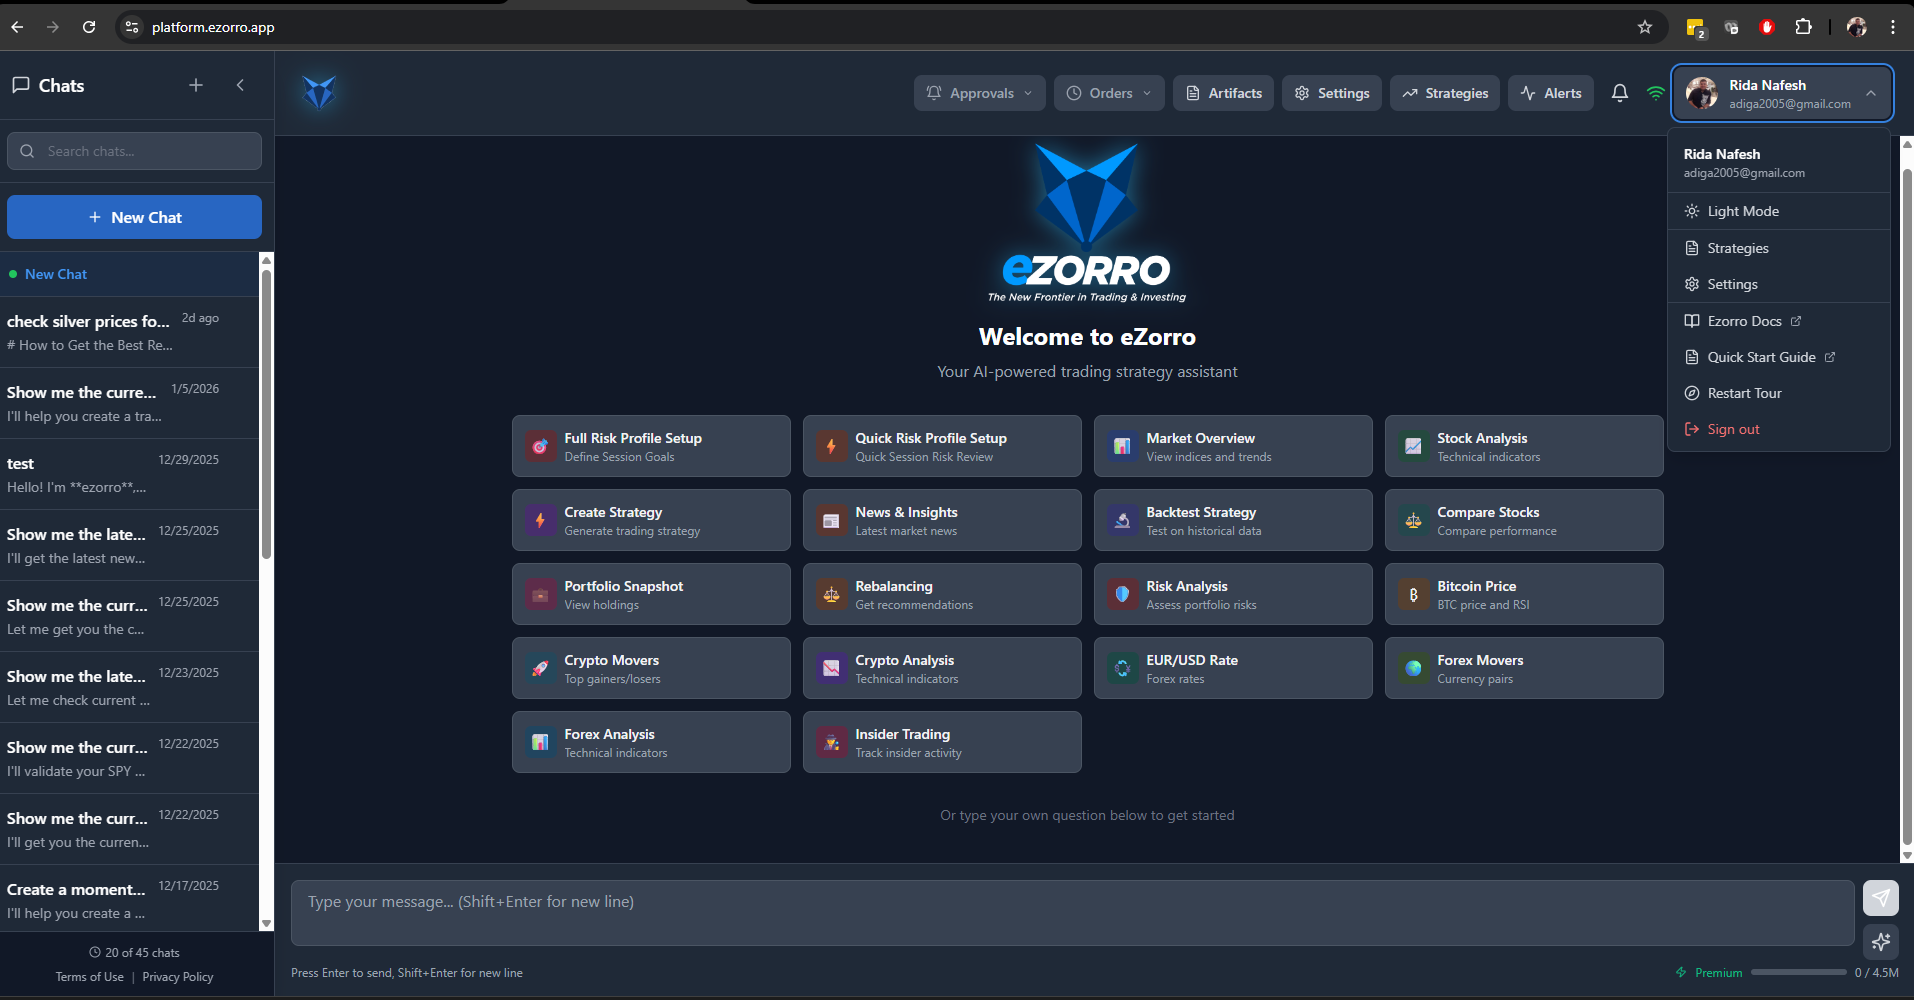
Use the landing tiles to kick off a chat
In the center of the page you’ll see quick tiles (examples: Market Overview, Stock Analysis, News & Insights, Create Strategy, Backtest Strategy, etc.). Use these when you want a guided starting point:- Click the tile that matches your goal.
- eZorro starts the relevant chat flow and produces an output in the workspace.
- Continue the flow by asking follow-ups (e.g., “add RSI(14) and EMA(50)” or “compare it to SPY”).
Best way to initiate chat (trader-focused)
A) Ask a clear market question (fastest results) Include:- Symbol(s)
- Timeframe (e.g., 15m / 1H / 1D)
- Horizon (intraday / swing / long-term)
- Output you want (chart, table, news summary)
- “Analyze NVDA on 1D and 4H: trend, support/resistance, RSI(14), and key catalysts this week.”
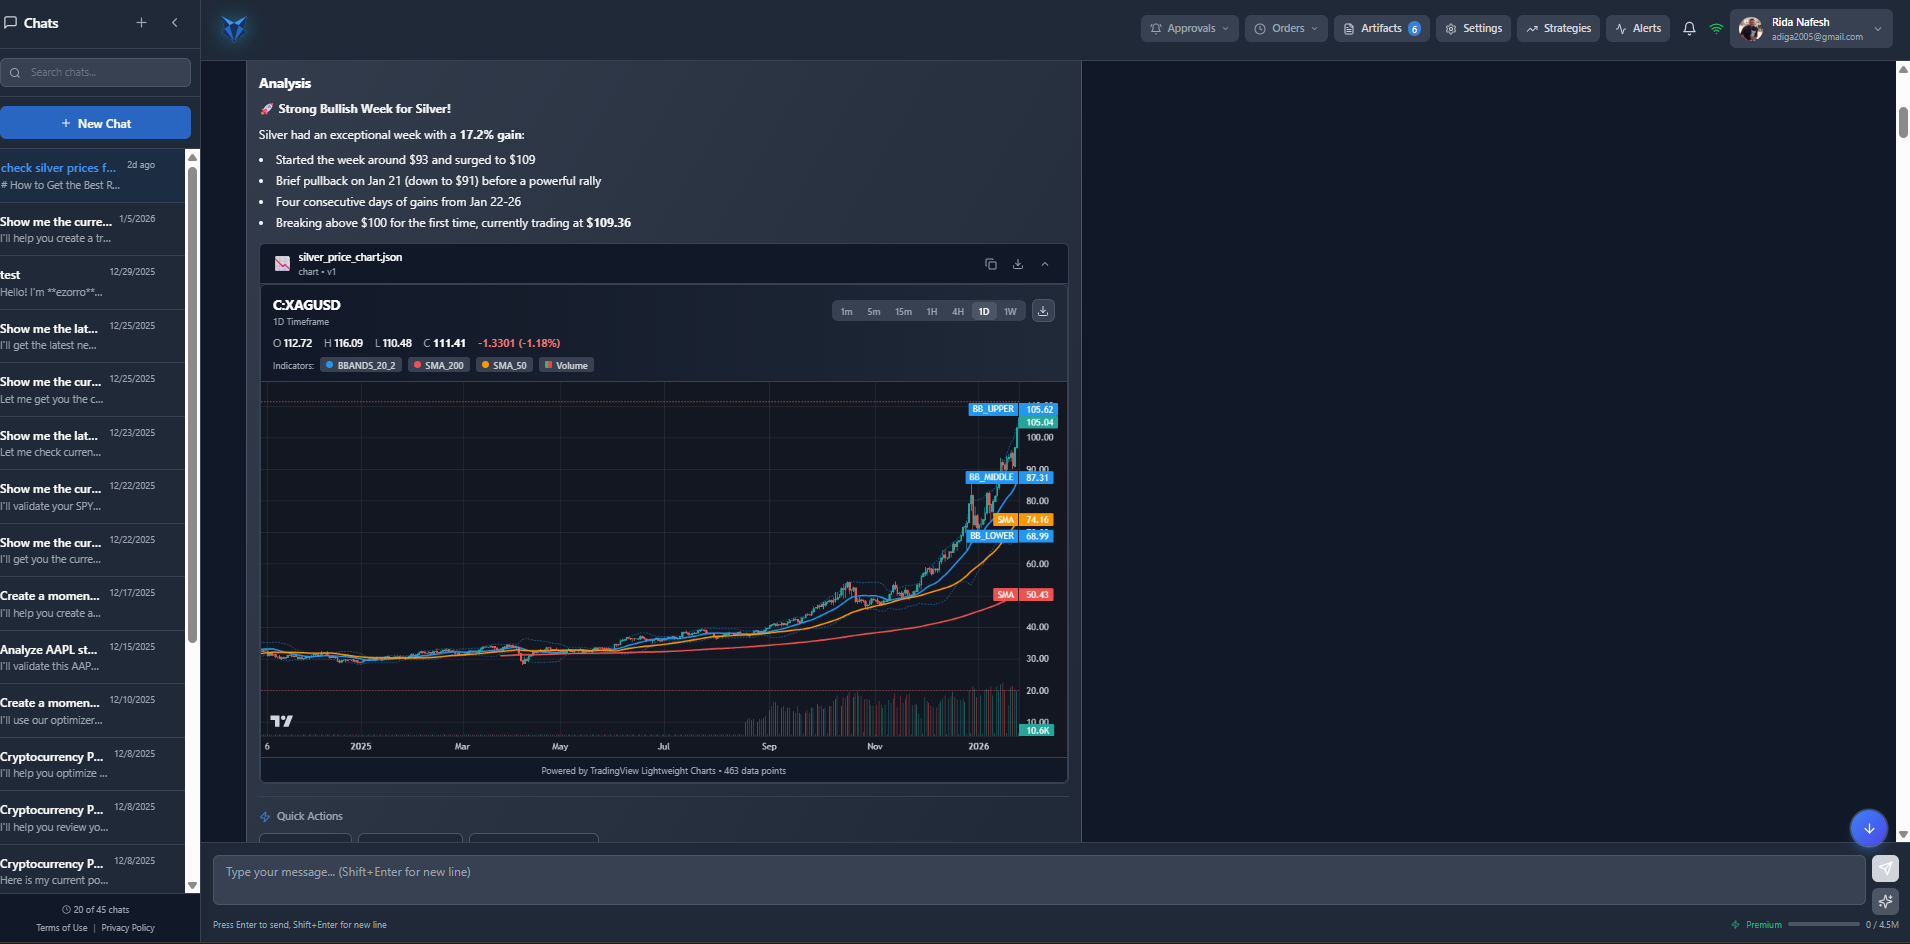
- “Show XAGUSD 1D chart with Bollinger Bands + EMA(20/50) and summarize the trend.”
- Strategy type (breakout / mean reversion / trend)
- Entry + exit rules
- Risk rules (stop, take-profit, sizing)
- Max trades / cooldown
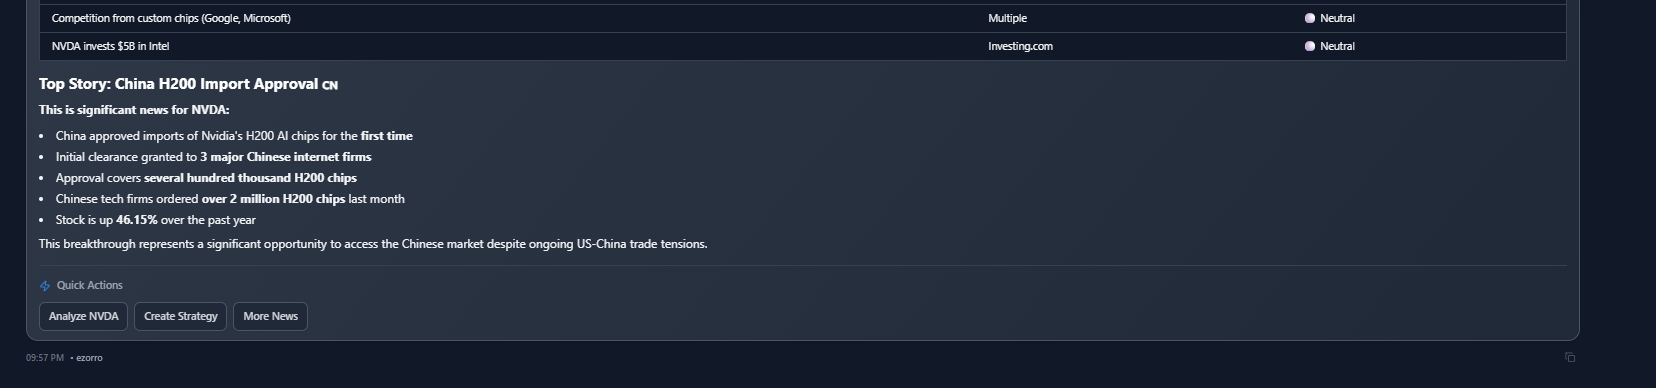
3. Use the built-in Call-to-Actions (buttons) at the end of responses
At the end of many responses in eZorro, you’ll see a Quick Actions area with clickable buttons (Call-to-Actions). These buttons are shortcuts that send a follow-up request for you—so you can move to the next step without re-typing.What happens when you click a button?
When you click a Quick Action button, eZorro automatically:- Uses the current context (symbol, timeframe, analysis you just saw), and
- Submits a pre-built follow-up prompt (similar to “suggested actions / quick replies” used in many chatbot frameworks).
Common Quick Actions you may see
Quick Actions typically fall into a few categories: 1) Continue research- Get News / More News → fetch and summarize related headlines
- Compare (or similar) → run a comparison view using the same timeframe/context
- Analyze [Symbol] (e.g., Analyze SLV) → expands technical/market analysis
- Create Strategy / Create Silver Strategy → generates a draft strategy using the context you’ve been discussing
- Show My Portfolio → pulls portfolio context (if broker is linked)
- Set Price Alert → opens the alert creation flow
Best practice: how to use Quick Actions effectively
- Use Quick Actions when the button matches your intent — It’s usually the fastest path because it preserves context automatically.
- Buttons are optional—typing is always allowed — Quick Actions help guide the flow, but free text gives you full control.
- Expect buttons to be “single-turn” choices
4. Create or refine a strategy, then backtest and run it
See the Strategies section below for detailed instructions.5. Link a brokerage account (optional)
Link a brokerage account to view portfolio and enable automated trading. See the Settings section below for details.Platform Layout
- Chats (left): Search chats, start new chats, and open chat history.
- Chat workspace (center): The conversation and generated outputs appear here.
- Artifacts (right): Saved outputs from chat such as Strategies, Charts, News, Docs, and Diagrams.
1. Using Chats (Core Workflow)
Chats are the main way to use eZorro. You can ask questions in natural language and request specific output formats such as charts, news cards, tables, or strategy artifacts.1.1 Start a New Chat
- Click New Chat in the left sidebar.
- Type your question in the message box at the bottom of the workspace.
- Press Enter to send (Shift+Enter for a new line).
1.2 Find and Reuse Past Chats
- Use the Search chats box to quickly find a prior conversation by keyword (symbol, topic, strategy name).
- Click any chat in the left list to reopen it and continue where you left off.
1.3 Ask for Market Data and Technical Analysis
Examples of what you can request:- Current price, daily/weekly change, and volume for a symbol.
- Trend summary and key levels (support/resistance).
- Technical indicators such as RSI, MACD, EMA/SMA, Bollinger Bands, ATR.
- Multi-timeframe checks (e.g., 15m + 1H + 1D).
1.4 Ask for Market News
You can request latest headlines for a symbol, sector, or theme and filter/sort results when available (e.g., sentiment or recency). Examples:- “Show me the latest news for NVDA and summarize the top 5 items.”
- “What are today’s key catalysts for gold and silver?”
- “Summarize today’s macro headlines that impact USD and yields.”

1.5 Call-to-Actions (Next Step Buttons)
At the end of many responses, eZorro provides Call-to-Actions you can click to continue the workflow without re-typing.- Analyze (symbol): opens a deeper analysis flow for the same instrument.
- Create Strategy: launches strategy creation using the current context.
- More News: expands the news feed and highlights additional items.
1.6 Get Better Answers (Trader Prompting Tips)
For the most actionable outputs, include these details in your question:| Detail | Examples |
|---|---|
| Instrument(s) | ticker(s) or pairs (e.g., NVDA, XAUUSD, EURUSD) |
| Time horizon | intraday / swing (days) / long-term (weeks+) |
| Timeframe | 5m, 15m, 1H, 4H, 1D, etc. |
| Goal | trend-following, breakout, mean reversion, hedging, portfolio risk |
| Risk constraints | stop-loss method, take-profit method, max drawdown, max trades/day |
| Output format | chart, table, Mermaid diagram, or a saved strategy |
If you request a strategy, always specify timeframe + entry/exit logic + risk rules. This improves backtests and reduces noisy signals.
Copy/Paste Prompt Templates
Market snapshot: “Give me a snapshot for SPY, QQQ, VIX, DXY, and 10Y yield. Include trend, key levels, and top 3 news drivers.” Trade checklist: “Evaluate a swing trade on NVDA (3–10 days). Confirm daily + 4H trend, key levels, RSI/MACD, and catalysts this week. Output a checklist + risk notes.” Strategy request: “Create a breakout strategy for TSLA on 1H candles. Entry: close breaks above 20-day high with volume > 20-day avg. Exit: trailing stop 2× ATR(14) or RSI(14) > 75. Risk: 1% stop, max 1 trade/day. Save the strategy.” Optimization: “Optimize this strategy for robustness across bull/bear/range regimes. Sweep RSI 25–35 and EMA 20–100. Return top 5 parameter sets with drawdown and win rate as a table.”2. Strategies (Create, Backtest, Run)
Strategies are usually created from chat. Once saved, they can be reviewed in Artifacts and managed in the Strategies area.2.1 Create a Strategy from Chat
- In chat, describe the strategy idea (entry, exit, risk rules, timeframe, symbols).
- Click the Create Strategy Call-to-Action (or ask explicitly to save the strategy).
- Review the saved strategy in Artifacts and refine if needed.
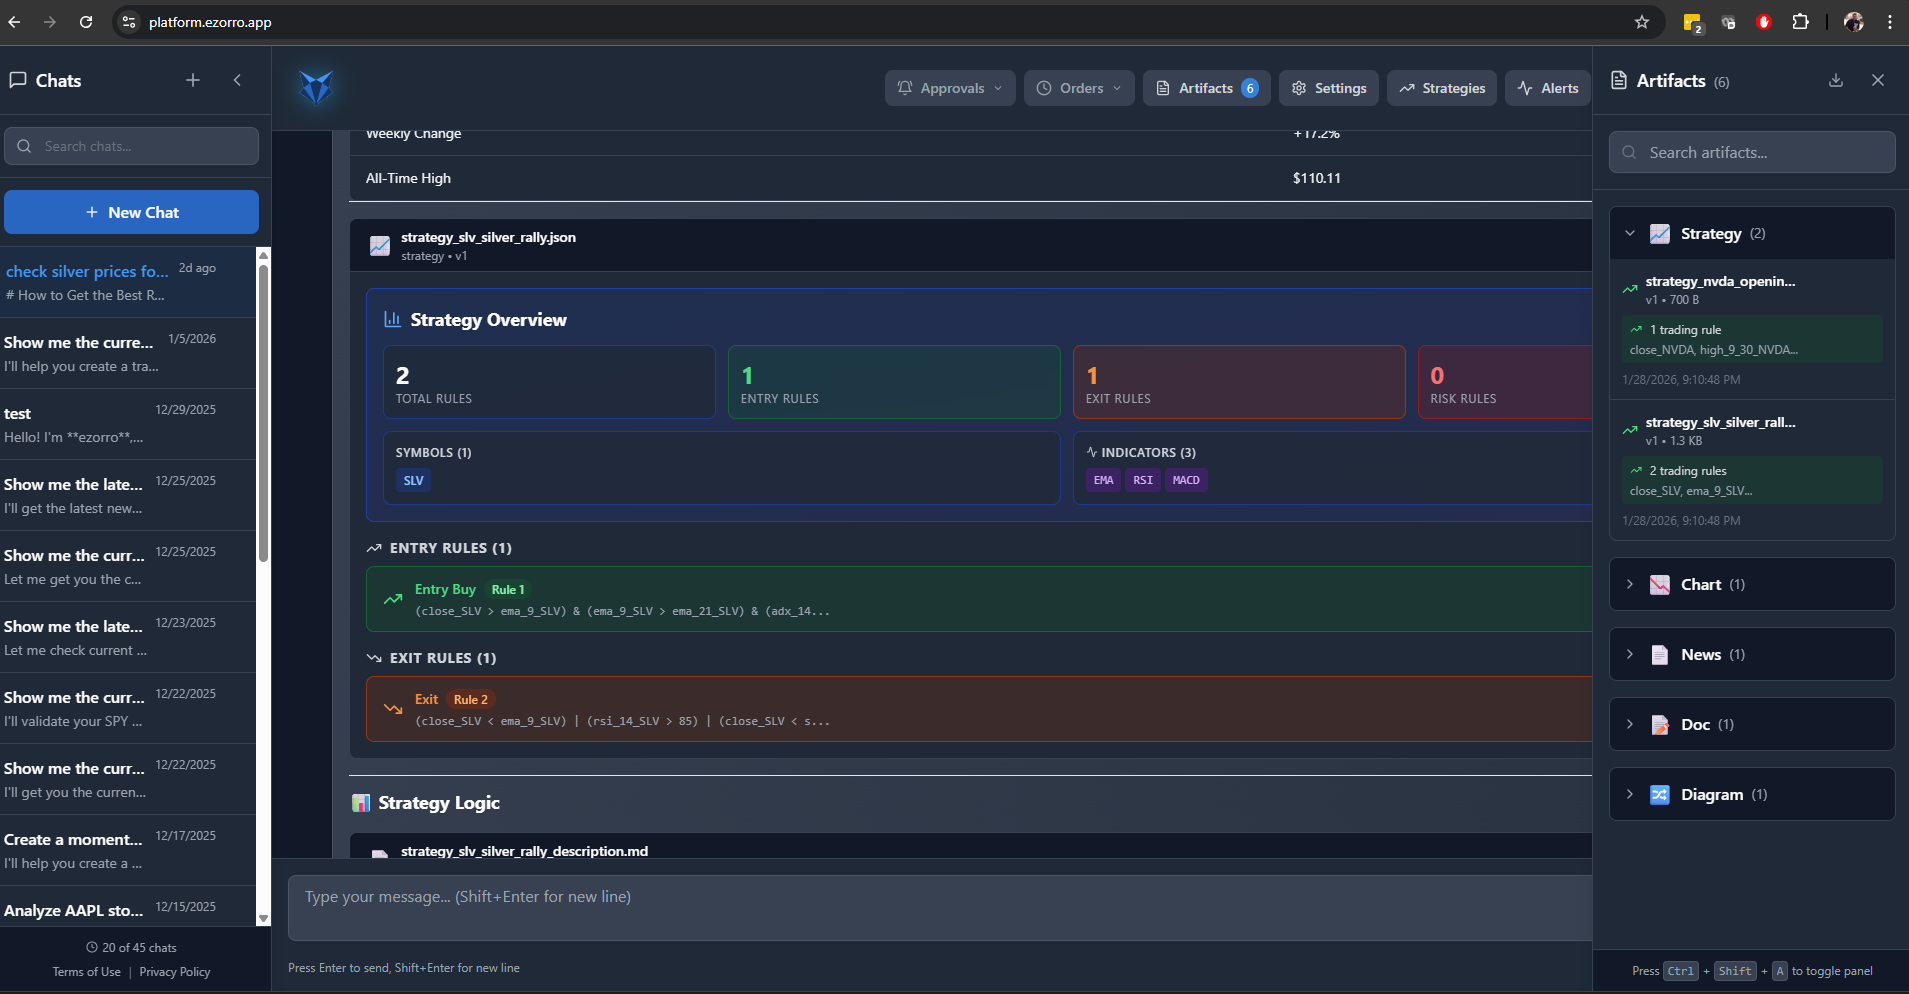
2.2 Review and Manage Strategy Artifacts
- Strategies include a summary (rules count, symbols, indicators).
- Entry/exit rules are shown in readable form and can be iterated by chatting.
- Artifacts also include charts, docs, and diagrams produced during strategy building.
2.3 Backtest a Strategy
After the agent creates a strategy, you can run a backtest directly from the chat:- Type in the chat: Backtest the strategy
- Or click the Backtest call-to-action button at the end of the agent’s response.
2.4 Run / Schedule a Strategy
After a strategy is backtested and validated by the agent as a good/profitable strategy, the system will provide an option to save the strategy to the Strategies list. From there, the user can:- Run: start running the saved strategy to evaluate market data and generate trade decisions.
- Schedule (Time & Dates): configure the strategy to run automatically on selected times and dates (or on a chosen frequency such as 5m, 1H, daily).
- Pause: temporarily stop the strategy from running without deleting its setup.
- Stop: fully stop the strategy until the user starts it again.
3. Approvals, Orders, and Alerts
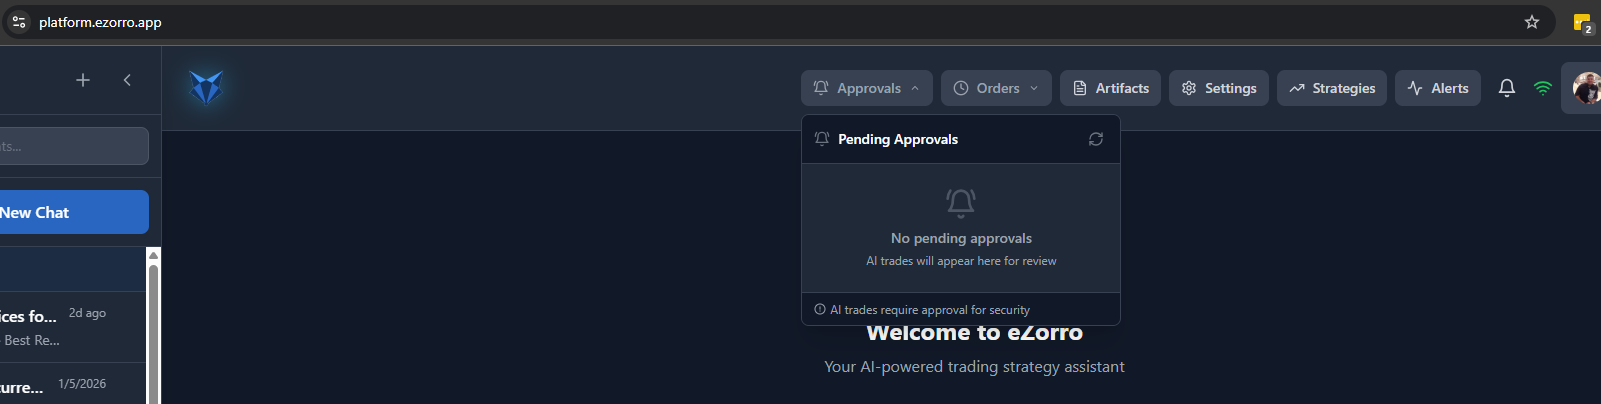
3.1 Approvals
Approvals is a safety control. When enabled, AI-generated trades appear here for review before they are sent to your broker.- Open Approvals from the header.
- Review pending items (symbol, action, size, rationale).
- Approve or reject, then refresh to update status.
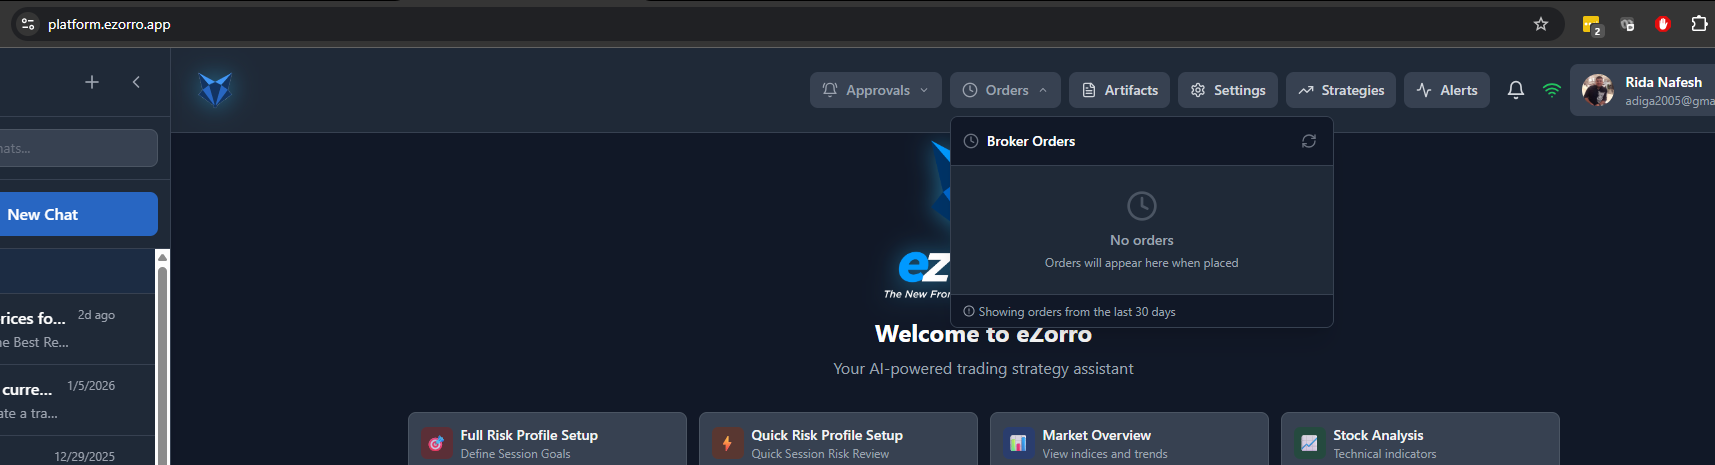
3.2 Orders
Orders shows order activity from your linked broker (manual or strategy-driven).- Open Orders from the header.
- Review recent orders (commonly last 30 days).
- Refresh to fetch the latest broker status.
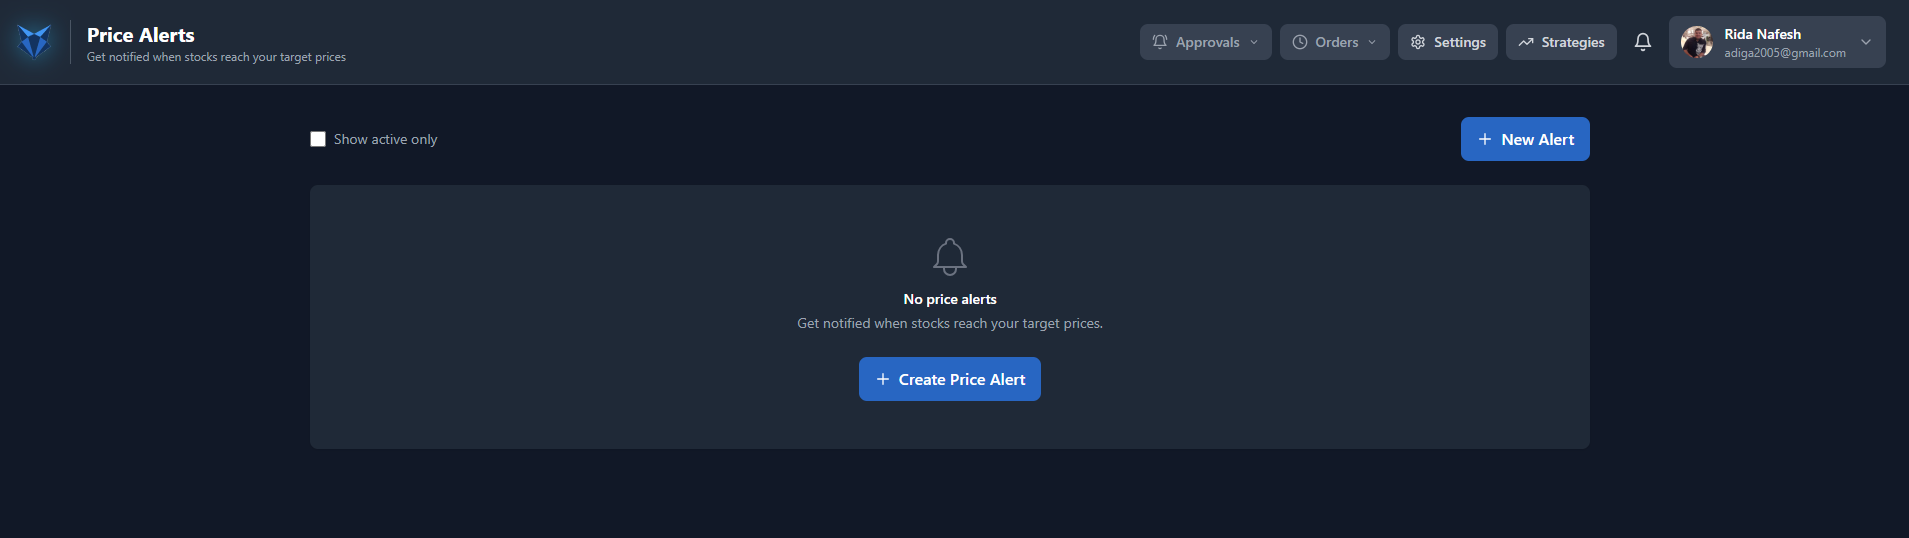
3.3 Alerts (Price Alerts)
- Open Alerts.
- Click New Alert (or Create Price Alert).
- Choose symbol, condition (above/below), and target price.
- Save the alert.
4. Navigation and Settings
4.1 Header Navigation
- Approvals: review trades pending confirmation.
- Orders: view recent broker orders.
- Artifacts: browse saved outputs from chat (Strategies, Charts, News, Docs, Diagrams).
- Settings: manage linked accounts and appearance.
- Strategies: manage strategies, backtests, schedules, and runs.
- Alerts: manage price alerts.
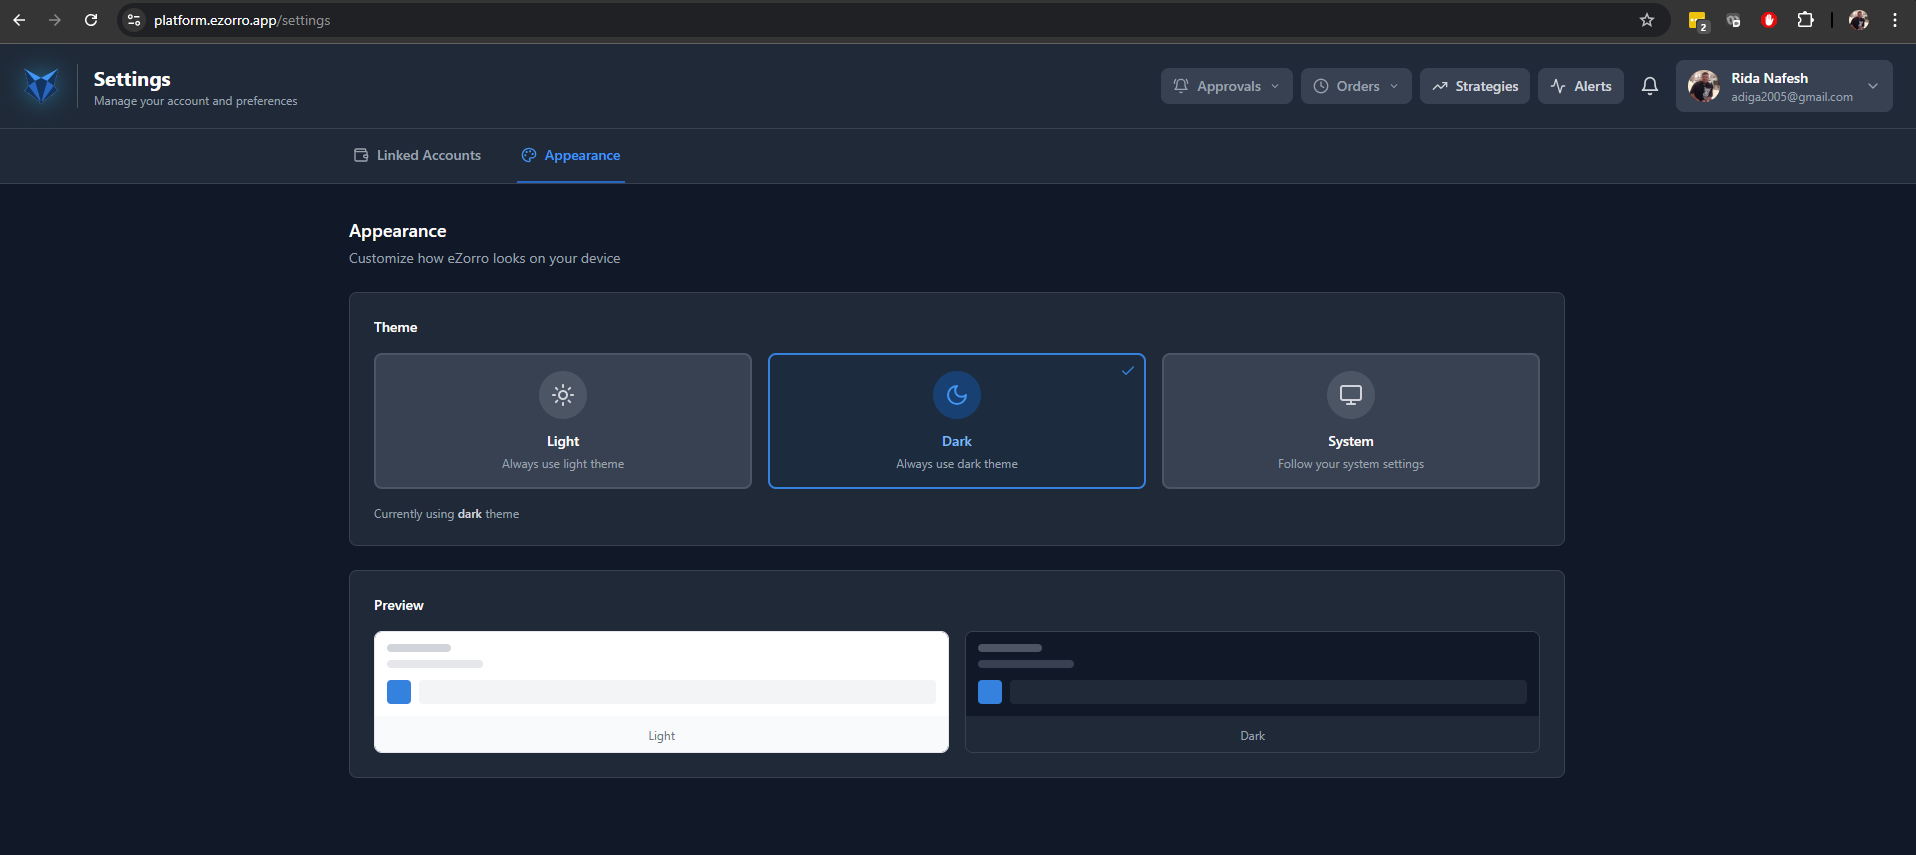
4.2 Appearance
Use Settings → Appearance to control the platform theme:- Light
- Dark
- System (match your device settings)
4.3 Link a Brokerage Account (Optional)
Linking a brokerage enables portfolio features and can enable automated trading. Linking is initiated inside eZorro from Settings → Linked Accounts.- Open Settings → Linked Accounts.
- Click Link Account.
- Complete the secure connection flow in the provider window (broker selection + authorization).
- Return to eZorro and refresh if needed.
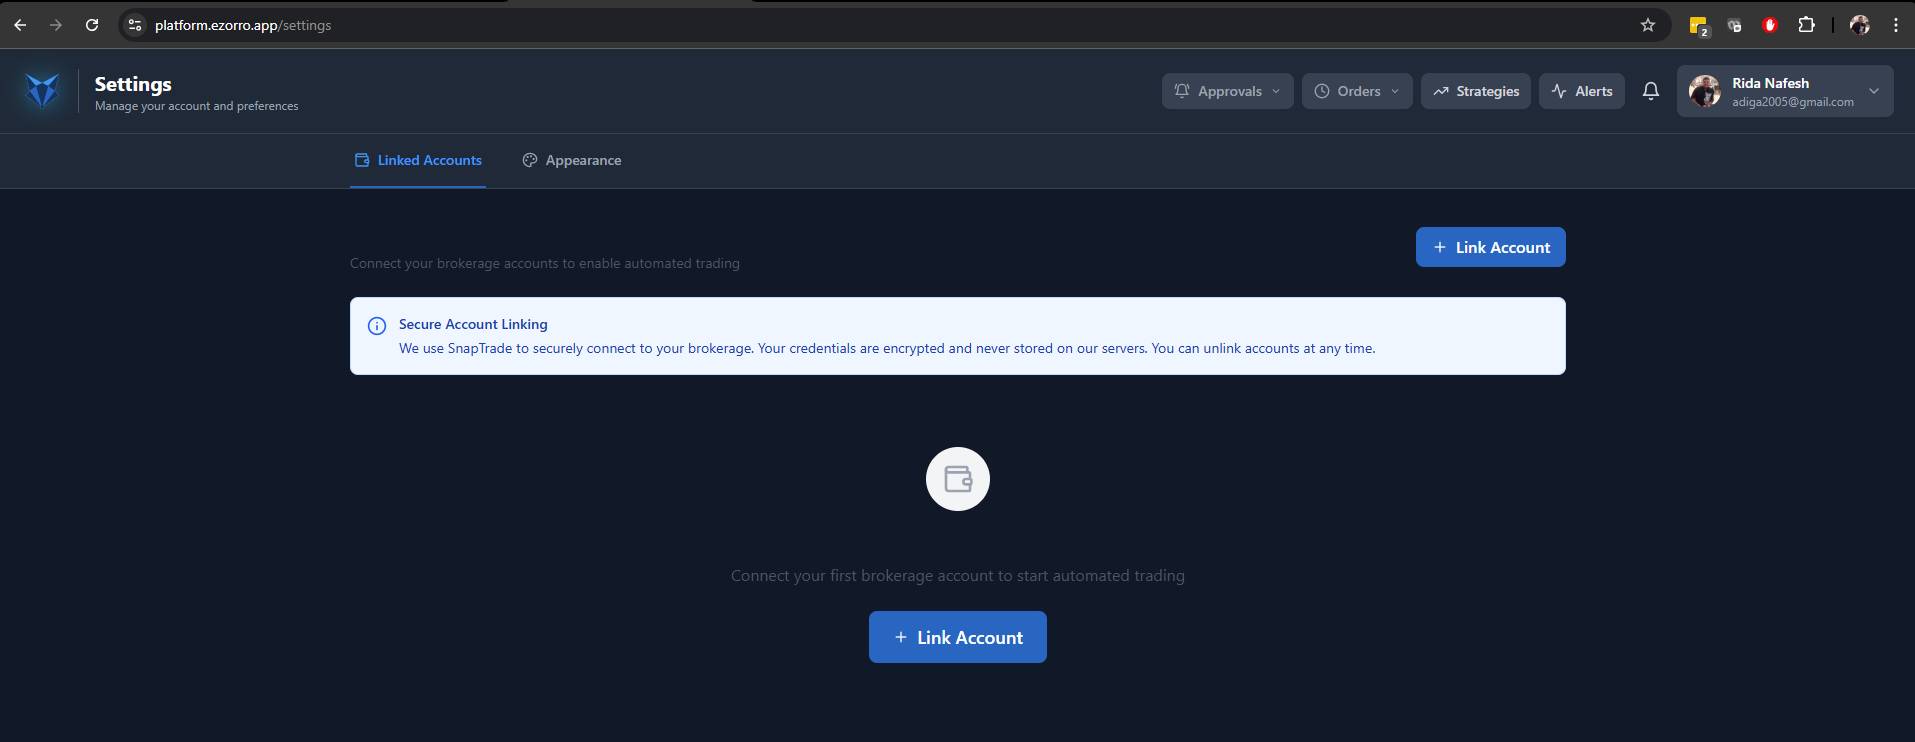
eZorro uses SnapTrade’s Connection Portal to guide users through brokerage selection and secure authentication/authorization.
5. Practical Risk & Quality Checklist
- Avoid overfitting: prefer simple rules that survive multiple market regimes.
- Include realistic assumptions (fees and slippage) where possible.
- Start small and monitor live behavior before scaling.
- Define risk limits: stop-loss method, max position size, max daily loss, max drawdown.
Trading and investing involve risk, including the possible loss of capital. Backtested results are hypothetical and based on historical data/assumptions; they do not guarantee future performance. eZorro does not guarantee profits or eliminate the risk of trading losses. Features and integrations are subject to availability and change.